Huygens Topography
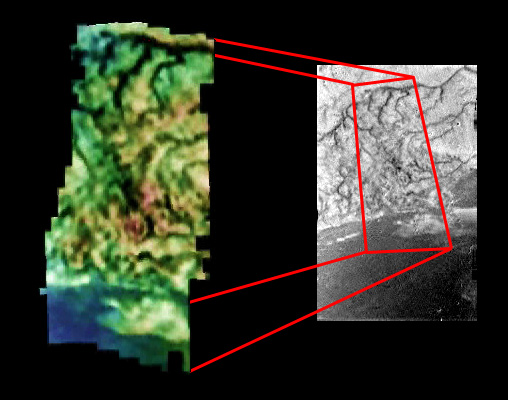
The DISR team has released an animation showing the topography near the Huygens landing site. The topography was derived from DEM-models created by using stereo observations of various regions on the surface of Titan as Huygens descended. The area shown above, topography from the movie on the left, a frame from Huygens on the right for context, shows the "shoreline"region observed by Huygens. You can see that the dark material near the bottom of the frame is definitely lower in altitude than the bright terrain. In addition, there appears to be a cliff associated with the dark channel near the top of the DEM model. Topography within the bright material is a bit hard to interpret but it is obvious that the topography and the morphology of the dendritic channels indicate flow from bottom to top, away from the "shoreline".
It should be emphasized that all the features seen in Huygens images are SURFACE features. Not fogs. Not clouds. Not giant animals. Surface features. I know people have occasional seen features move on the surface or features look like waves, but so far nothing has indicated standing liquid from the spectra or surface analyses.
posted by Jason Perry at 12:16 PM
![]()
![]()

18 Comments:
There are a few of us, who are of the opinion that the entire set of Huygens photos are literally meters from the surface, and the imaging is of a dynamic, changing scene: The Heat shield hitting the surface of Titan, raising a cloud of dust, and leaving stress fractures in on the brittle Titanian surface.
This would explain why the terrain near the "ocean" is higher than the dendrites.
I'll assume then that the case is closed on fog or clouds in the Huygens images. Although the following quote shows that this possiblity was considered.
http://www.spacedaily.com/news/cassini-05o.html
Lakefront Landing In Creme Brule
by Henry Bortman for Astrobiology Magazine
"A puffy band of white can be seen along the shoreline in images taken by Huygens as it neared the ground, although it doesn't appear in images taken from higher elevations.
"In describing this white material, Marty Tomasko, principal investigator for Huygens' imaging camera, suggested that it was 'pehaps a thin ground fog, possibly of methane or ethane.'
Other scientists look at the same scene and see the white material as surf crashing along the shore.
"All of these impressions, though, are preliminary. Huygens' science teams have had less than 24 hours to process the vast quantity of data returned by Huygens."
Memories of these sorts of statements at the time of the landing stuck in my mind. I don't recall seeing any statement, until yours, that closed the case.
One hundred meter wide drainages 3-6 hundred meters apart, and less than 4,000 meters long?
I have seen cracks with these proportions in mud, but not on the kilometer scale.
I don't know what the radar scaling is - none of it has been released, but I do know some of the images have been rescaled in later ESA releases. Do you really have radar data, and how was it syncronize with the imaging data? The images where supposed to be in 30 degree increments, but that obviously did not happen.
The temperature and velocity during descent, the optical scatterubg and density, the speed of sound, none of the data released to date is consistent with expectations.
I think that there is good evidence of a dynamic scene, especially in the multiple images of the crack regions, demonstrating both minor and major feature alterations as a dust spread over the surface, creating a virtual blurry photographic negative of this same area.
These 'stringy' images are after the crack images in the raw data image files.
Huygens has a message for us, and it is not anything like what most of the world was expecting.
Those numbers aren't completely unheard of on earth, particularly if we are looking at rain run-off dendritic channels. These tend to cut shallow and often wide channels, particularly if the countryrock is tough to erode.
In terms of the Huygens team knowledge of their altitudes, I think that IS one thing they do know for sure. Radar altimetry has been used in many applications on Earth, Mars, and now Titan by two spacecraft. Sure, it is possible for them to be off by a few tens of meters, but not a few tens of kilometers which is what would be required for you to be right. Also, for you to be right, Huygens would have to be within a few meters of the surface for an hour and a half, which again is VERY unlikely.
Yes, Titan appears to be quite different from what many scientists expected, but that has nothing to do with the use of radar altimetry or its interpretation.
First I would like to compliment Jason for providing this site to discuss Titan. As a retired geologist I find our planetary neighbors very interesting , particularly Titan . It appears to possess geomorphic features quite similar to earth as all of you have pointed out. Early on I suspected the drainage features showed flow away from the dark plain but have not been able to observe a drainage divide which should separate them from the plain which is topographically lower.
Sometimes I wonder if what we see is a result of visual illusions.
In case any of you are interested in this phenomena refer to www.michaelbach.de/ot.
Ben
Rene, I think your argument suffers the same problem as Jerry's. The altimetry from Huygens is one thing that is known for certain, as Bruce described. Other "degrees of freedom", like tilt or even azimuth, are reconstructions since the sun sensor didn't function properly because the probe was rotating the wrong way. So while it may look like there is a good fit at 2-2.5x the stated altitude, it is just as impossible.
That's not to say that we don't have serious problems with the currently direction considered north and the scale of features. I think the tip of "Australia" is a good match, even at the right altitudes, but with the direction considered north by the DISR team, we have a problem. I have a meeting with the DISR folks tomorrow so maybe we can try to sort this out.
BTW, nice reconstructions! I'll post about that in a minute.
Rene,
2 quick questions, Are you using Terragen for your renders? and how are you calculating the light levels?
[quote](The ESA actually includes the altitude figures for each frame in the movie they made out of about half of Huygens' returned photos.) In fact, we have that data from a second source as well: Huygens' air pressure measurements (which also turned out to be precisely as predicted).[Unquote]
That is surprising to me, because if the air pressure is very near the predicted values, the optical density numbers do not make any sense - why isn't a nitrogen atmosphere scattering light the way we know it should?
As Rene points out, there are many features that can be overlayed with only very slight altitude adjustments. I'm anxiously awaiting the complete data release...
Bruce, I don't see how you reconciliate your description of the radar data with Tomasko's imaging data. Tomasko says the the probe was tipping as much as 90 degrees during the decent: How could they get a radar profile that was 'very close to the predicted model'? As I understand it, they were predicting less than 8 degrees variance in attitude.
How was the radar data corrected for this high degee of swinging motion? I would think that it would completely lose track of the surface at times.
Why didn't the radar pick up the duplicating pass over the same topography?
The organic smog in it is rarified by Earth standards, but there's a tremendously thick layer of it due to Titan's combination (unique in the Solar System) of low gravity and dense atmosphere.
This answer makes no sense. The optical density was LESS than expected, not greater. The higher the optical density, the lower the transmittance. For an atmosphere of Nitrogen alone, the density was expected to be about 20. - it was only 1.5 on the surface - if the pressure profile was correct, it should have been much darker, not lighter, and an additional smog factor doesn't help.
Puzzling...Here is my reference
http://www.planetary.org/news/2005/titan_lpsc_0819.html
'The height of Titan's atmosphere alone should make it "optically thick," ... Titan's many haze layers make the atmosphere thicker than a pea-soup fog -- or so scientists originally thought.
"We were expecting optical depths of 20 to 25," Tomasko reported. But near Titan's surface, the optical depth of the atmosphere was found to be much lower than that, about 1.5, at least in near-infrared wavelengths.'
In the same article, Soderblom's interpretation of the imaging indicates repetitive images and "excessive chaotic tip and tilt all the way down.":
'As a result of the more-vertical-than-expected descent, the DISR cameras imaged the same real estate on Titan over and over again.
This repetitious imaging allowed team member Larry Soderblom to track in great detail the motion and tilt of the probe during the very last portion of the descent. Again, what he found was unexpected. There was "excessive chaotic tip and tilt all the way down," he said, where the probe rocked back and forth as it slowly spun and descended.'
So it doesn't sound like everyone is working of the same page...
Never thought this would be the most commented on article...
To answer a few misconceptions:
-----
"We were expecting optical depths of 20 to 25," Tomasko reported. But near Titan's surface, the optical depth of the atmosphere was found to be much lower than that, about 1.5, at least in near-infrared wavelengths.'
The writer of the article is confused here. Optical depth in the atmosphere of Titan (and I would assume most any atmosphere) varies with wavelength. In Titan's atmosphere, because of the effects of methane absorption of light and from the scattering effects of the haze, optical depths are much higher at ultraviolet and violet wavelengths than at red and near infra-red wavelengths. The DISR teams has photometers, spectrometers, and cameras that cover a wide range of wavelengths, from violet to the near-infrared out to about 1.6 microns (or 2 microns, I forget which). Anyways, the DISR team was expecting an optical depth of 20-25 for VIOLET wavelengths, which they could measure with their violet photometers, one looking up and one looking down. This help to gauge the number of photons at violet wavelengths reaching the surface. The expected no violet photons at the surface but instead they found a few, but still putting the optical depth in the high single digits to low 10s. Not sure what their optical depth number is.
The 1.5 optical depth value is for near-infrared wavelengths, 930-938 nanometers to be precise. This is near expectations, though this optical depth value has been changing depending on the week I talk to Marty Tomasko. some weeks it has been in the 2 to 3 range, which is higher than we expected and is difficult to reconcile with our ISS observations (we see the bloody surface which we shouldn't if the optical depth is 3). I should point out that this doesn't mean that the actual optical depth is changing in the atmosphere, the DISR just does different calculations with their data and derive different optical depths.
So to summarize, the optical depth at violet wavelengths was expected to be 20-25 but was found by DISR to be lower than that, but the 1.5 value is for much longer wavelengths in the near-infrared and is near expectations.
------
In the same article, Soderblom's interpretation of the imaging indicates repetitive images and "excessive chaotic tip and tilt all the way down.":
just as magnetospheric and atmospheric scientists have different ideas of what is a "substantial" atmosphere, there can be varying opinions on what constitutes "excessive chaotic tip and tilt". In parts of the stratosphere, Huygens was tilting as much as 90 degrees due to very high winds. Below this, the tilt is in the neighborhood of 3 degrees or less. This is enough to effect the results of someone who is putting together images from such a tilting platform. Remember Larry is trying work with 6 degrees of freedom in the images, some of which are not well constrained from spice data which we use for Cassini ISS images for geometry. So any tilt can be a problem for him. This amount of tilt is NOT, I repeat, NOT a problem for the altimeter. As Bruce alluded to, even if it were not pointed straight down, it had a wide enough beam, given the level of tilt, to lock on to the ground.
--------
Thanks Jason,
This is a good clarification, and those of us trying to look through the team interpretations for alternatives are handicapped by the generic nature of what has been released.
I understand and appreciate the science teams taking there time, but I am also aware there is a lot of effort being made to 'lock in' the observational data with prior expectations, and this can and does influence interpretations.
Jason-/Also, for you to be right, Huygens would have to be within a few meters of the surface for an hour and a half, which again is VERY unlikely./
I was finally able to look at some of the Atkinson presentations, and I did not see anything inconsistent with the possiblity Huygens was on the surface less than thirty-five minutes from Time-of=entry.
Very specifically, in the 'A channel' data reconstructed from Earth, after ~27 minutes of Doppler signal, all motion ABOVE NOISE LEVELs IS pro-rotational, and if you subtract Doppler shifting assigned to wind from the Doppler shifting assigned to vertical descent, the two curves CANCEL each other out - Exactly what MUST be observed if the probe was sitting on the surface at a different latitude from what is assume to be the entry point.
Hopefully, the point of entry can be pinned down by the VLS triangulation.
The other plots (pressure, temperature) I have seen lack error bars, time axis, so I get to wait until the full reports are issued before conceding my interpretations are impossible or idiotic.
Rene, try putting the images together without ANY prior scaling information - I can find a lot of overlapping features if scaling is less than 20%
The DISR was designed to take a 360 panorama as soon as it was activated, then index off the angle from the sun at 30 degree increments, but since it was not able to lock on the sun, how fast would the images have been taken?
The Tech notes I have says it could capture images at about 8 frames a second, so the total descent image count MAY have been achieved in the less than ten minute budgeted before landing - I agree this is unlikely, but so are black arroyas.
Atkinson included some radar plots - both A&B radars - a lot of noise and ambiguity - I need a lot more information to do a reconstruct, exact altitude of ambiguous vrs unambiguous lock, radar timing correlated with the housekeeping data.
I am looking at the way Huygens would have interpreted opening her eyes and seeing the ground less than 1 km away, Suspended from the 8 meter parachute in thick air, bouncing erratically from the unexpectedly harsh braking...
The winds are pro-rotational so movement to the east is not unexpected. However, movement did vary with longitude with time until landing. In addition, reconstruction of the images into mosaics show that the spacecraft moved over the surface from decreasing altitudes for 2 and a half hours, moving along an easterly ground track. Remember, in addition to knowing the precise altitude, they also know the time a particular image was taken, again supporting the penetrometer and accelerometer data that the impact occured 150 minutes after atmospheric entry.
So again, the data from all the instruments does not support your contention.
Are you certain tbe images contain a time stamp? Likewise, the time stamp on the acoustic imaging is very important, but to my knowledge, not yet publicly available. The detail here is very important.
What is impossible or idiotic depends upon the physical model.
The DWE's descent profile includes a roller-coaster shear-zone with a wind differential of more than 500 knots in a ~30km atmospheric band width. Such extreme atmospheric conditions must have assignable causality, and this should be obvious from Cassini - where the Titan equatorial cloud movements don't mate with ANY of the DWE's wind profile at ANY altitude. Carolyn Porco describes this disparity as 'problematic'. I think it is impossible.
There is another solution.
Are you aware that the navigational team has again raised the altitude of closest-approach to Cassini? They are experiencing an unexpected 'drag force' that cannot be accounted for in the molecular head count, and the disparity is severe: a factor of 2-3.
What the DWE team is modeling as 'unexpected' shear winds IS the true descent acceleration - just like Cassini, Huygens experienced much greater-than-expected gravitational attraction and clocked through the upper atmosphere at the measured Doppler speeds. There is no zone of inexplicable shear winds, Only Huygens falling like a rock until the eight meter parachute was deployed, braking Huygens to a near-stop at a low, altitude.
When the DISR was activated, Huygens was already well below the 'ambiguous radar' threshold. This is why the first 'skyward' look in the violet light band was so highly disbersed, and also why there was so little variation in both the violet and IR ranges. Likewise the Mach numbers, temperatures, and speed of sound all have narrow bandwidths.
The atmospheric density cannot be 'exactly as expected' and still yield these bazarre shear winds, and anomalous optical and thermal effects. The model is flawed by the failure of one of the fundamental assumptions: Newtonian gravity.
John Anderson's team of gravity wizards will eventually sort this all out: The gravitational anomalies identified at Ganymede are multiplied by a factor of two at Saturn's orbit and they are observing this, but you might as well have a head's up and start looking at Huygens' Titan photos as the macro images that they are: Cracks in a muddy surface and rocks, not black arroyas and 'ice pebbles'.
I don't think Huygens drifted at low altitude for more than a few minutes - the 8 meter parachute should have been cut loose after ~20 minutes, shortly after the DISR imaging system was activated. That is why the time stamps are very important.
By the way, the penetrometer was a one-shot system, running in a continual loop, that was designed to lock-and-hold the final seconds before-and-after a threshold event until the computer polled the device for the data.
The problem is, the computer was not even scheduled to poll the penetrometer and landing accelerometer until the altimeter reported the probe was below 1km. So the altimeters could easily have still been assuming the radar lock was ambiguous and high, when the probe landed.
This scenario is consistent with the messy plots I have seen of BOTH radar altimeters. The penetrometer was eventually polled, but not until a time-out overide of the altitude sequence ~ 14 minutes after the expected landing time. Huygens had been sitting on the ground for an indeterminate time when the penetrometer buffer was finally polled and time-stamped.
And we all wonder what happens next.
Rene,
Slide 62 in Soderblom's presentation contains identical features at '14.8 km' and '6.7km' altitudes:
http://www.mrc.uidaho.edu/~atkinson/Huygens/DWE_Presentations/Soderblom/
There are two more nearly identical images on the right side of slide 55
I say almost identical, because in the smaller image, there appear to be fewer cracks. This could be a resolution issue, or it could be because the cracks propagated between frames - rather impossible if they are km scale objects.
We have identified at least four different images that overlay this same small piece of real estate, with a dynamic scene that correlates quite well with the sound track of the altimeter.
On slide 49, the -arrow shape- when viewed in 3D appears to be suspended...especially in the second and forth images. An optical illusion, or is this a tattered hemline from what is left of the heat shield thermal blanket?
In slide 62, you are looking at images from two different cameras. The first in both sets were taken in the HRI camera that is looking between 6 degrees from nadir to 20 degrees from nadir, so you are looking more or less straight down. In the second image, you are looking at the feature in the MRI camera, which looks between 20 degrees from nadir to 45 degrees from nadir. So the features are moving from being more or less straight to being closer to the horizon as the spacecraft has descended.
Again, the one thing that is known FOR SURE, is the altitude at which various images were taken. That is the one of the six degrees of freedom that that DISR scientists have a great handle on.
Again, I don't see where this certainty comes from - not the actual data - at least not if the view-graphs I am looking at are correct.
According to the DWE team's Bonn Presentation, Huygens was 1100km off-target and traveling 240 k/hr faster than expected when she first started broadcasting the A-channel data picked up on Earth.
The velocity continued to increase until ten minutes after the transmission started, then suddenly decelerated at an average rate of more than 1m/s^2 for six minutes - at a time the predicted rate of descent was ~ 5m/s.
The Doppler wind team has used wind shear to explain the rapid descent and change in velocity, but nothing explains why Huygens was so far off-target target in the first place, let alone what on Titan could produce 240 km/hr vertical winds.
Look how benign, how layered, the atmosphere of Titan is in Cassini's ephemeris images. Assuming 240 km/hr shear winds in a cold, dense nitrogen atmosphere is nuts!
About four minute later, the 3m parachute was scheduled to be deployed, and the imaging system started snapping pictures. But after such a wild ride, what was the altitude? Shouldn't Huygens have been much lower than expected if the descent rate was, on average, ~200 km/hr faster than expected?
How could anyone say with any confidence, what altitude the probe was at? I have already pointed out both radar altimeter plots are noisy, each demonstrating periodic 'drop-outs', and if the descent rate and wind velocities were so screwed up, why would the time/pressure charts be balls-on?
Rocks. Not water-ice rocks. Rocks.
Post a Comment
<< Home