Thursday, August 24, 2006

Pluto Relegated to Second-class citizen

My name is Jason Perry, and I'm here to tell you the truth.

Today, the International Astronomical Union made a mistake by demoting Pluto from a planet to a "dwarf" planet, a second-class citizen of the Solar System. Rather than basing their decision on the nature of the object in question, they included a discriminatory stipulation that a planet "must clear the neighborhood around its orbit". And rather than stick with this abomimation of a definition, they further go on to stipulate that 8 objects apparently fit this definition. This elitist attitude to our icy brothers and sisters is gross and tragic error that must be corrected. This defintion would not only prevent Pluto from being a planet, but would prevent currently undiscovered objects beyond Neptune larger than the current smallest, so-called "planet", Mercury, from being a planet.

I say that it is none of the IAU's business what a planet commingles with. Whether it is a gas planet with trojan asteroids, terrestrial "planets" with smaller "asteroids", or an icy "planet" with other icy objects. I say we stand up with our icy breathern and fight this embarrasing definition.

Viva las lunas rojas!

Monday, February 13, 2006

The Return/The Olympics/Lucilla

It's nice to be back here after a 5 month absence. This blog will no longer be on the Cassini mission and news on various satellites of Saturn, but will be about me. Basically, I am replacing "Ionian Journal", a second blog I had but never updated, with this one. I changed the name of this blog to reflect this change, though Guabonito is still a Titan related name. Guabonito is a broken ring of bright material in eastern Shangri-la on Titan.

So, it is good to be back. This weekend, I officially started my Olympics addiction. Every 2 years, I become glued to the TV to watch arcane sports like nordic combined (wow, jumping 100 meters on skis, then racing 9 miles on skis), water polo (like basketball in a pool), and short-track speed skating (roller derby on ice). What is it about the Olympics that compels people to watch sports that they wouldn't watch at another time but the Olympics. I'm sorry, but if there was a nordic combined competition on, I would watch it unless I had a gun pointed at me. Granted I still won't watch figure skating (prancing around on ice, no matter how many times you can spin around, is NOT a sport), but yet now I want to watch luge (but not two-man luge, that just seems wrong for some reason), snowboarding, downhill alpine skiing, etc. Maybe NBC Universal puts something in the water supply...

Lucilla, my 9-month old Bell albino leopard gecko, is finally eating again after taking a month off. She ate a few times over the last month, but usually it wasn't sustained, maybe eating one or two crickets here and there. I finally figured that it was partly my fault. See, I would put the dusted crickets in a food dish, sans there back legs and their front legs to keep them from escaping the disk. However, this often ilmobilized them more than I wanted, and by the time Lucilla was interested in hunting, the crickets barely moved. Geckos hunt using the movement of their prey to key on them before striking (think T-rex in Jurassic Park) so this lack of movement caused Lucilla to not be interested in them. So last night, I waited for Lucilla to go into hunt mode (her eyes become dilated, she stares out her hide, focusing on my movements), threw four unmolested (except for the dusting) crickets into her cage, and she went after them. She ended up bagging three of the four. Good for her. She certainly looked happy after getting some hunting in.

That's all I have for now.

Saturday, September 17, 2005

The End Part II

Okay this really is the last post. I just want to nip in the bud, right here, right now, shutting down this site was my idea. No one, and I mean no one, asked me to shut it down. I received some comments regarding some top level manager's opinion on my recent posts on the T7 issues (which I should point were temporary and have been fixed). It was a mistake for me to even discuss them here, even in the vague manner I tried to convey, and their disapproval was brought to my attention. This issue scared me. It was fun when this site was just a small group of people who wanted to hear the latest from Cassini. But if I need to be concerned about what I write, then it becomes less fun. I love what I do, I can't imagine myself doing any better at this point in my life, and I will not jeopardize it for a blog. I'm sorry, but I won't. And rather than look over my shoulder and wonder if what I just sent is kosher with everyone who are higher up than me, I'd rather just end this page. I apologize to all those who have come to rely on this page. I really do. Don't stop caring about the Cassini mission just because I'm not here to blog about it.

Now, that's not to say I am completely going away. Last night, I decided rather than give up here and do nothing with volcanopele.blogspot.com, I will just change the format. I have had this novel, essentially in my head for 5 years now, waiting for me to actually commit it to paper. I've decided to write it here on this blog. I'm not sure how this will work but I think it will be an interesting experiment. Based on similar projects on Blogger, I will post a segment of the novel every few days, once a week or so, on a post. It could be a chapter, it could be more, it could be less. I personally like that concept. So I am going to give it a try. So on September 24, this blog will be replaced by "Afterword". I hope some of you come back for that.

Friday, September 16, 2005

The End

This will be the last post of this blog. I know a lot of you have come to rely on this site for information on the Cassini mission, but it appears that I will no longer be able to continue posting here. Ironically, this site was killed by its success. This site was read not only by people in the public, but by those in the Cassini project as well. I knew full well of this, but apparently I crossed a line with one of my posts last week, and they called me (litterally) on it. This site was only going to stay up as long as I got something out of it and you did too. Now, this site has become a lot less fun. So, effective immediately, I will no longer be posting on this blog. I will probably post occasionally on the Unmanned Spaceflight.com forum, but will likely become a lurker. I will keep the site up for the next week, when I will then shut it down for good :-(

New Titan Image: Canyonlands on Titan


The Cassini RADAR team released this view of Titan taken last week during the T7 flyby. This cutout from their SAR noodle is located near 55 degrees South, 7.5 degrees West and is approximately 300 km long. Unlike the previous image, the channels in this region consist of long valleys (up to 200 km long and 200 meters deep) that have only a few tributaries. These channels are more akin to river systems on earth rather than the arroyos seen in the T3 swath and in the previous image.

New Titan Image: Titan's Rain Drains to the Plains


This is the second of three views released by the Cassini RADAR team showing portions of the RADAR SAR swath returned last week. This portion is from south central Tsegihi near 48 degrees South, 14 degrees West. This view extends 240 kilometers from left to right. At top, you can see a deeply incised channel flowing from a region of bright, rough terrain down to darker, smoother material. This fits with the view that methane rains wash material from the bright highlands down to darker plains. Near the bottom of the image, there is a branching network of channels, with the widths of the channels varying. These properties are suggestive of rainfall run-off channels rather than river networks.

Still, note how well this liquid has eroded these channels. These are quite deeply incised, suggesting either that the liquid efficiently erodes the bedrock, or these channels have been active for a good percentage of geologic time.

New Titan Image: Shoreline on Titan?


The RADAR team on Cassini has released some of their SAR swath taken on September 7. I will post my comments on all three cut outs. This portion is near the very end of the part the were able to get back. The second half was lost. This portion shows a possible shoreline in the central part of the dark albedo feature known as Mezzoramia. On the left, you can see terrain that is suggestive of erosion by liquids, with alcoves and scarps. At right, the surface is quite dark suggesting that the area is much smoother than any other place so far looked on Titan by Cassini RADAR. Many of the bright features that bound this terrain are similar to shoreline terrain on Earth.

This portion of the swath is from 66 South, 356 West in central Mezzoramia. This portion is 330 km wide and 175 km tall.

Cassini Significant Events for 09/08/05 - 09/14/05

Haven't mentioned one of these in a while, but this week's Cassini Status update is now online. Regarding the mishap during last week's Titan flyby:
A significant amount of science data was lost during the recent Titan flyby as a result of an operational problem at the DSN tracking station, and a software error on the spacecraft. The software error was the larger contributor of the two causes, and the data loss resulted from an improperly set flag preventing the spacecraft from writing to or reading from the A side of the solid state recorder, so the result was performing the encounter with only half of the expected data storage volume. Commands will be sent on September 15 to reset the flag to its proper value, and normal operation is expected after this. The nature of the code error is now fully understood and has been reproduced in the spacecraft test bed. A decision will be made in the near future whether to correct the flight code or to implement workarounds to prevent the conditions that led to execution of the faulty code.

These problems led to the loss of all data after 1 minute prior to closest approach (because the "B" recorder was full at that point) as well as our high resolution mosaic, VIMS' medium resolution mosaic, and the RADAR inbound altimetry data. We did, however, obtain our global mosaic (a portion was released publically earlier this week) and RADAR received a portion of their SAR swath over central Tsegihi, Mezzoramia, and some features a little farther to the east.

Wednesday, September 14, 2005

New Telesto Image: Squinting at Telesto


CICLOPS has released this processed view of Telesto, taken on August 1 from a distance of 768,000 km. From that distance, the 24-km wide Telesto appears as nothing more than a blog of light with no discernable features or shape. Believe it or not, this qualifies it as one of the best images of Telesto thus far (Voyager's best image was ~ 5km/pixel) But, fear not, better images of Telesto are coming. Cassini comes within 9800 km of this small, trojan satellite on October 11, 2005. This will be one of the closest flybys of a small satellite during the tour. At closest approaches, images with a resolution of 56 m/pixel are possible (~425 pixels across Telesto's disk).

Tuesday, September 13, 2005

Off-topic: Cassini finally sees spokes in Saturn's B-ring


Not exactly satellite-related, but as has been alluded to on a few discussion sites in the past week, the Cassini Imaging team announced today that they had finally observed the spokes, first seen by Voyager but had not been seen by Cassini. The spokes appear to be bright wispy features on the B-ring in the above image and in the images released today. These images are of the unlit side of the ring, so the B-ring appears dark due to its opacity and the C-ring, at lower left, appears bright. Saturn's limb can be seen toward the upper left corner. Pretty neat stuff.

New Titan Image: Monitoring Fensal-Aztlan


CICLOPS has released this mosaic of the Fensal-Aztlan (formerly known as the "H") region on Titan. Fensal is the northern branch of the "H". Fensal has some subtle brightness variations and has quite a few bright spots, or "islands", dotting the region. Their distribution appears to be more scattered than similar sized bright spots in Shangri-la, west of Xanadu. There, the spots were clustered into several "archipelagoes" and aligned in a similar fashion, usually east-west. The spots in Fensal don't seem to have a prefered orientation. A few larger bright spots can be seen in Fensal, including Bazaruto Facula on its eastern end.

Aztlan, the southern branch of the H plus the dark region surrounding Elba Facula to the east (not in this particular crop), has far fewer smaller islands, but does have several large islands, including Sotra Facula, a 240 by 120 km sized bright feature just right of center in the lower left frame, and Coats Facula, a smaller island to the east of Sotra.

This mosaic is just 4 frames within a larger, 20-frame mosaic to be released later. This mosaic was taken during last week's T7 encounter.

Monday, September 12, 2005

DPS Titan News

Emily Lakdawalla at the Planetary Society has posted on her blog quite a few notes from the Titan DPS talks. Unfortunately, not much is news to me so it is rather difficult for me to remember what has been publically mentioned and what is new. It is a great read and and I definitely recommend checking it out.

Friday, September 09, 2005

New Rhea Image: Frame-Filling Rhea


CICLOPS today released this processed image of Rhea taken on August 1, 2005. This image was taken from a distance of 255,000 km and has a resolution of 1.5 km/pixel. As the title suggestion, this image was taken when Rhea nearly filed the entire narrow-angle camera field-of-view. Nothing shocking from Rhea, just lots and lots of craters (with a few fractures up at the top toward Rhea's wispy terrain). This image primarily shows the southern trailing hemisphere of Rhea. Two prominent impact basins, ~300 km across can be seen along the terminator. The top basin is unnamed but the second basin is Izanagi. This basin was the site of one of the pre-launch artwork done for the Cassini mission. No sign of the fractures shown in that rendition.

Wednesday, September 07, 2005

T7 Coverage Map


CICLOPS has released the coverage map for today's flyby of Titan. Cassini ISS will examine the sub-Saturnian hemisphere of Titan, particularly around the Fensal-Aztlan region (formerly known as the "H"). The coverage for this encounter will primarily come from two mosaics. The first, MONITORNA001 outlined in green, is a 2 km/pixel mosaic over the entire visible disk. This is similar to other full-disk mosaics from Ta and T3. The second mosaic, COMBINED001 outlined in red and yellow, is a higher resolution mosaic consisting of many images near the center of the visible disk. Key targets for this mosaic include features within Fensal, Aztlan, Quivira, and northern Tsegihi regions, such as Bazaruto Facula (with its 80-km central crater), Omacatl Macula, and the debris deposit in northeast Aztlan that bisects Quivira.

A map showing RADAR SAR coverage is also available.

New Dione Image: Older Southern Fractures?


CICLOPS released today this processed view of Dione on August 1. This image was taken from a distance of 269,000 km and has a resolution of 2 km/pixel. The wispy terrain of Dione can be seen toward the top with Padua Linea running from top center to right and Palantine Linea running along the terminator at left. In contrast to these relatively sharp fractures, the fracture systems near the south pole, just to the left of the large impact basin, have relatively subdued topography and are probably older than the fractures that make up the wispy terrrain. The radial feature near the center of the disk, Cassandra, was thought to be caused by a ray crater, but analysis of the topography associated with the feature now shows that Cassandra likely has a tectonic origin.

Note the two craters just to the left of Cassandra. These craters have a similar shape to Ali Baba and Aladdin craters on Enceladus, perhaps indicating local heating in that region of Dione, in order to produce the viscous relaxation we observe.

New Look

The formatting and column issues have bothered me (and others) for the last time. I have switched to a different template within Blogger to see if that helps, but a few features from the old template, like recent posts, are now gone :( I will try to fix that soon enough.

Tuesday, September 06, 2005

Titan-7 Flyby Info


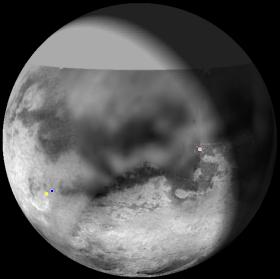
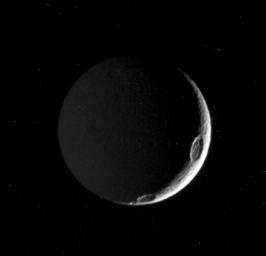
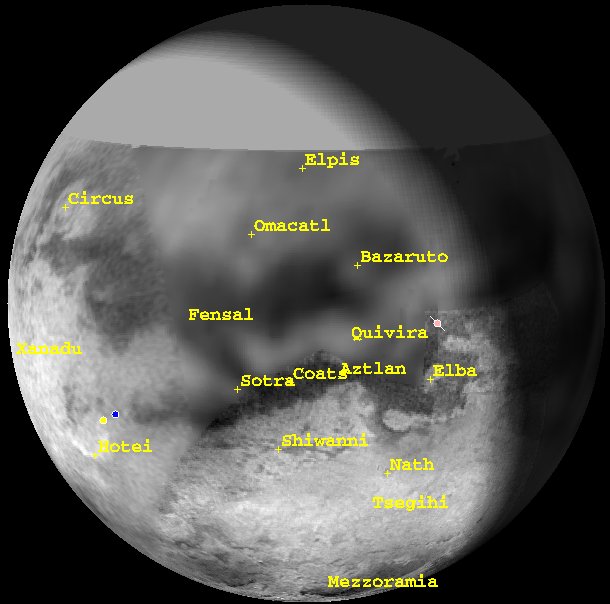
View of Titan from Cassini 2 hours into ISS' high resolution observation, about 3 hours prior to closest approach (sub-spacecraft point=4.4N, 26.2W). The plot was generated in GISS' Titan 24 software. The map is derived from ISS map released in March (ask for full version used here, just adds blank space north of 34N). The full version of above plot is available as well as one with feature labels. The data for plot was obtained from Mission description document.

T7 Quick-facts:
  • Closest approach occurs on September 7 at 1:33 am PDT
  • Closest Approach Distance = 1075 km (bumped up from 950 km)
  • Relative speed WRT Titan = 5.9 km/sec
  • Closest Approach Lat and lon = 67 South, 308.1 West
  • South Polar Pass with sub-Saturnian hemisphere visible inbound
  • Outbound flyby (sunlit inbound)
  • Phase angle at -3hours = 51.5 deg.
RADAR SAR and ISS imaging highlight the science plans for tonight's T7 flyby of Titan. This is the 8th flyby of Titan out of 45 planned for the nominal mission. The 7th flyby, T6, took place on August 22, and yielded plenty of data for CIRS and MAPS, but not much for the other remote sensing instruments. However, during T7, RADAR, ISS, and VIMS make up for lost time.

This flyby is lower than the August flyby, with Cassini coming within 1075 km of the surface of Titan. This is higher than the originally planned 950 kilometers. Many of the 950 km flybys may have to be similarly raised due to higher atmospheric densities at higher altitudes than expected. As you can see in the above plot, Cassini will once again look at the sub-Saturnian hemisphere of Titan on its inbound leg. This hemisphere has been in view of the last 3 flybys, but have no fear, Cassini will return to the anti-Saturnian hemisphere and the Shangri-la region during T8 in late October.

ISS controls the spacecraft for much of the period prior to closest approach. Two large mosaics are planned. The first is a mosaic at about 10 hours out. This should have similar coverage and resolution to the global mosaics taken during Ta and T3, global with a resolution of about 2 km/pixel. The second is a higher resolution mosaic taken from 5 hours out to about 1 hour out. The coverage map for this mosaic should be out soon, but this mosaic would have enough time to build up a large mosaic with similar coverage and resolution to those taken on Ta and Tb. Overall this is shaping up to be one of the better flybys for ISS in some time. Phase angles are similar to those from the past few orbits, higher than those from Ta-Tb-T3. Lots of interesting features at the center of the disk including Bazaruto Facula (with an 80-km wide crater at its center), Quivira with its possible channels and a debris deposit bisecting the feature and flowing into Northeast Aztlan, and Omacatl Macula.

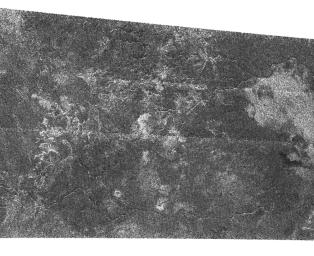
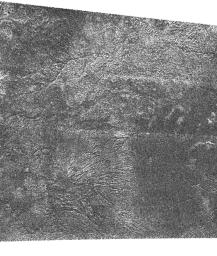
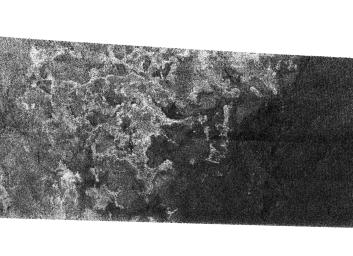
RADAR is back for T7. So far, RADAR has acquired two SAR (synthetic aperature radar) swaths, first on Ta and again on T3. Both swaths covered portions of the northern leading hemisphere. On this encounter, RADAR SAR will acquire a swath over the southern sub-Saturnian hemisphere. I have produced a coverage plot for this swath, though I would ask that it not be reproduced on other sites. The swath starts out in north central Tsegihi, an area of bright terrain, which appears to be similar to Xanadu but slightly darker in albedo. Like Xanadu, Tsegihi is a region of mottled terrain, though with less contrast than Xanadu. Continuing along, RADAR will run into Mezzoramia, a "dinosaur-shaped" dark region that maybe a temporary reservoir of seasonal rainfall run-off from the south polar region. Images of Mezzoramia from July of last year indicated a possible difference in how sharp the southern and eastern boundary is compared to the western and northern boundary. It will be interesting to see if such a difference is detected in the RADAR coverage of the region. The SAR swath continues to as far south as 77 degrees south Latitude, even farther south than Ontario Lacus, a 235-km wide dark feature that maybe a lake. Many of the lake-like features near the south pole appear to concentrated on the leading hemisphere side of the pole, though this could be an emission angle effect (surface contrast improves as you approach the sub-spacecraft point). So RADAR SAR may miss most of the larger "lakes", but smaller features, like those seen on Ta, are possible. T0 images reveal a possible dark feature that maybe similar to Ontario Lacus to the southeast of Mezzoramia, near 70 South, 330 West, so that might be something to look out for. The eastern half of the SAR swath is in a region not seen very well by Cassini ISS (best pixel scale ~ 35 km). This region could be very similar to the area seen by RADAR on Ta, with a lot bland terrain puntuated by the occasional volcanic center.

RADAR also has altimetry and radiometry on this pass. Altimetry will cover the bright-dark southern boundary of Chang-tu at the far eastern end of the RADAR SAR swath. There should be altimetry at the far western end as well, checking for topography associated with Shiwanni Virgae and north-central Tsegihi. Hopefully, the altimetry won't show a slope to the east this time ;-) RADAR Radiometry will look at the thermophysical properties of the northern anti-Saturnian hemisphere, to compare with results from Ta, which looked at the northern sub-Saturnian hemisphere. This data, taken after closest approach, will cover the region that will be seen by RADAR SAR in late October during T8, an east-west swath that will cover central Belet and central Adiri. This region will also be see quite a bit by the remote sensing instruments, like ISS, later in the mission.

Of course, other instruments will gather data during this encounter. UVIS has their second star occultation of Titan's atmosphere, this time using alpha Pegasus (Markab). UVIS will be using the occultation to look for N, N2, and hydrocarbons at various latitudes. This is a "glancing" occultation since the star will not pass behind the limb of Titan, only the upper atmosphere. The December 2004 occultation of lambda Sco allowed UVIS scientists to detect various hydrocarbons like methane, acetylene, diacetylene, ethane, ethylene, as well as Hydrogen cyanide in Titan's atmosphere as well as measure the abundances of those species. VIMS is prime for almost 4 hours on approach to Titan, starting around 8 hours and 45 minutes before closest approach. This will allow VIMS to create a full-disk mosaic similar, but at lower resolution, to our MONITOR mosaic taken shortly before VIMS' MEDRES observation. VIMS will also take a few snapshots near closest approach northeast of Shiwanni Virgae. CIRS and the Fields-and-Particles instruments will also be active on this encounter. CIRS will be continuing to look for variations in the distribution of hydrocarbon species both temporally and spatially. The MAPS instruments, like MAG and MIMI, will continue to examine the interaction between Titan and Saturn's magnetosphere.

Playback of T7 data takes place during two playback periods. The ISS images of the surface will be returned tomorrow night and Thursday morning and should show up on the JPL raw images page Thursday afternoon, PDT. The rest of the data will be played back starting at around 5:30 am Friday morning, PDT and will continue until around 2 pm PDT. Images from this period, mostly from after Closest approach, should be on the raw images page Friday evening. RADAR SAR data will be played back during this playback period, so don't expect any data from them to show up until at least Monday, and even that is pushing it. Given the weekend and the fact that a number of RADAR team members are in transit from the DPS conference that takes place this week, I wouldn't expect any images from the RADAR team until at least Wednesday. I know that's a long time, but we should have patience with the RADAR team in getting their data assembled.

DPS News and Notes

The AAS' Division of Planetary Sciences Conferences is taking place as I type in Cambridge, England. No, I am not there. But the Planetary Society's Emily Lakdawalla is and she has a great blog post with some of the results from yesterday's Cassini talks. Among the highlights include Larry Soderblom's confession that the DISR mosaics may have north off by as much as 15 degrees counter-clockwise, which is a major relief for me given my work to try to find the landing site in ISS images. Given their current understanding of "north", I could not find any site that matched orientation of the islands seen in the DISR images. Now with this revelation, there is a solution (easternmost tip of Adiri). Larry also mentioned the planned coverage by RADAR SAR of the landing site in T8. This swath is an east-west pass across central Belet and Adiri. The RADAR team extended the Beam Three path (at the expense of altimetry) to try to cover the landing site, but the signal/noise ratio maybe a bit low, I'm afraid. Hopefully, something good will come out of it and we can start making sense of all our data. FYI, RADAR SAR swaths are composed of five beams (you may have noticed the seams in early RADAR products). Beam three is the center beam and has the best signal to noise ratio. The Principal Investigator of the HASI instrument on Huygens reported that his instrument found a number of inversion layers in the Titan thermosphere. This confirms the INMS result that showed a number of waves in the methane and temperature profiles in the upper atmosphere. Apparently this wave structure continues down to at least 510 km. Now why is this so important... The SSP and the Permittivity Sensor on HASI both detected slight changes in conditions at the surface after landing. The increase in permittivity and changes in the speed of sound and spacecraft tilt maybe related to the vaporization of methane by Huygens as it sat on the surface, but that is just one possibility.

There were a number of results from the instrument teams from onboard Cassini. Many of the major results announced today were related to the rings and Saturn, and rightly so since admittedly they have gotten very little press coverage compared to the satellites so it is good they have their day in the sun. But this is a blog about the satellites, so who cares about those results ;-) Most of the Enceladus results were announced earlier at a press conference but some instrument teams did clarify them. VIMS last week announced they had found crystalline ice (absorption band at 1.65 microns) and simple organics (absorption band at 3.44 microns). During his talk, Bob Brown mentioned that the aborption band is attributed to a C-H stretch. In other words, it is some kind of organic compound, but VIMS can't tell what it is with just this one absorption band. Brown also announced that VIMS had not found any ammonia on Enceladus, shutting the door on ammonia-water volcanism. I'm not sure I agree with him there, but we may want to look at models that don't include ammonia. This also fails to explain how INMS saw N2. The CIRS principal investigator, Mike Flasar reported on results from Enceladus. In addition to the hotspot in the south polar region, CIRS found a relatively low thermal inertia, indicating that Enceladus is covered in unconsolidated material. Perhaps due to infalling E-ring material.

Finally, the RADAR team presented their results from T3. The most interesting features in that swath were the numerous linear to sublinear dark streaks, nicknamed cat scratches. These features have been interpreted as linear or longitudinal dunes, similar to those found in Saudi Arabia and Australia (near "Lake" Eyre). However, the RADAR team has been comparing the scratches to icy dunes in Antartica, which are visible in RADAR images of the continent, but not so much from the ground. The dunes take the form of changes in grain size rather than topographic features that one could see from the ground. Such an interpretation would jive with ISS' inability to resolve the scratches if both the dunes and the material that fills in between them are dark at 938 nanometers.

RADAR also released an image yesterday showing these dunes and a couple of drainage channels west of the "Circus Maximus" impact basin.

New Janus Image: The Two Faces of Janus


CICLOPS has released this view of Saturn's moon Janus taken on August 2. This view shows only a slim crescent of Janus lit by sunlight, highlighting a couple of craters near the terminator. On the left side, however, Janus is dimly lit by Saturn, to the left of this image. Several large impact craters are visible in the Saturn-shine.

Janus is a small, irregular satellite of Saturn, only 181 km across. Cassini's closest encounter with Janus won't come until the very last day of the nominal mission, June 30, 2008, when Cassini is scheduled to come within 45,000 km of the surface of this satellite. Cassini flew within 50,000 km of another small satellite of Saturn, Pandora, yesterday for Cassini's closest encounter with that satellite during the nominal mission.

Monday, September 05, 2005

Pandora Rev14 Non-Targeted Encounter


Today, Cassini will come within 52,000 km of the surface on one of Saturn's small, inner moons, Pandora. Pandora acts as one of the shephards of the thin F ring, orbit just outside of the ring. Pandora is a small, irregular, with a diameter of 114x82x62 km. Voyager views of Pandora's surface showed a ancient, heavily cratered world, but Cassini views, like the one above, suggest that, though heavily crater, small-scale topography may be subdued, perhaps due to F ring material mantling the surface.

This encounter with Pandora, while not a targeted flyby, will provide our best views of the satellite thus far and at 52,000 km, this will be the closest Cassini will come to this satellite. The best possible images from Cassini at closest approach would have a resolution of 300 m/pixel over the satellite's trailing hemisphere (assuming that it rotates synchronously which I believe it does).

Images and other data from this non-targeted encounter should be returned tonight or tomorrow.

Friday, September 02, 2005

More New Titan Names

The IAU's Working Group for Planetary System Nomenclature (WGPSN) has approved 12 additional names for features on the surface of Titan. These include names for various albedo features on the surface of Titan, including the northern H region. Two additional types of features are included in this round of names, like Arcus (arc-shaped features) and large ringed features, ring-shaped albedo features that are currently thought to be craters. Some of the highlights in this round of naming include:
  • The feature previously nicknamed "Pelopennesos" is now known as Oahu Facula. This feature is similar to the other bright "islands" in Shangri-la, but appears to be connected by a narrow isthmus to Dilmun.
  • The bright, Arc-shaped bright feature, associated with a very bright spot at 5-microns, has been named Hotei Arcus.
  • The feature previously nicknamed "Manhattan" (because it is shaped like a big apple) is now known as Texel Facula. This feature is located at the far eastern end of Antilla Faculae in western Shangri-la.
  • The VIMS "snail", interpreted by the VIMS team as a possible volcano (or cat feces, depending on who you ask), is now Tortola Facula.
  • Several ring-shaped features have been named, including two in eastern Shangri-la near its boundary with Xanadu (Guabonito and Veles) and in north-central Tsegihi (Nath).
  • The northern H region is now named Fensal. A possible name now for the H region as a whole could then be "Fensal-Aztlan"
The USGS site now has a map with names.

Thursday, September 01, 2005

Enceladus Animation

The Photojournal has an animation with a wrap-up of the results from the July flyby, showing both the effects of Enceladus on Saturn's magnetic field as well as showing the great images and fantastic mosaic produced during the encounter. Definitely worth checking out.

Arcus on Titan

The IAU's Working Group for Planetary System Nomenclature (WGPSN) has approved the feature type, Arcus. This term will be used for arc-shaped albedo (possibly topographic as well) features. This feature type would applicable to such features as the "smile", found to be very bright at 5 microns by VIMS.

No word yet on additional names for Titan and this "arcus".

New Tethys Image: Tethys in the Dark


CICLOPS has released this processed view of Tethys taken on August 3, when Cassini was 842,000 km from the satellite. Only a thin crescent was visible of Tethys at the time this image was taken, when the phase angle was 144 degrees. Images like these can be used to study the photometric properties of the surface material on Tethys, particularly with how backward scattering it is. Two good sized craters can be seen along the terminator, or the dividing "line" between night and day. The one at about the 3:30 position is Penelope. The smaller crater near 5:30 is Antinous. While it hasn't been stretched to make it visible, much of the left part of Tethys' disk viewed here is lit dimly by Saturn-shine. This technique, however, requires longer exposure times than those used here to be useful for geologic analysis.

This image has a resolution of 5 km/pixel.

Tuesday, August 30, 2005

Enceladus' Tiger Stripes


A lot of big news today about Enceladus as all the major instruments on Cassini reported their results. Most of the results revolve around the four prominent fractures in the south polar region known collectively as the "tiger stripes". These "stripes" are actually tectonic fractures, 140-170 km long and a couple of hundred meters deep. In the IR3 filter on the Cassini Narrow Angle Camera, sensitive to infrared light around 920 nanometers in wavelength, the fractures are surrounded by dark material lying between 2-5 km on either side of the fractures. When combined with the green and UV3 filters for stretched color images, the stripes appear blue to blue-green. On one of the stripes, a darkish spot, 3 km in diameter can be seen.

To sum up what we have learned today from VIMS, we know that the coarse-grained ice along the edges of the tiger stripes consists of crystalline ice (based on an absorption at 1.65 microns, not seen elsewhere on the satellite), which only forms at temperatures above 110 K. These crystals will degrade over time after cooling below 110 K thanks to the radiation environment, in a few decades up to a thousand years. This is what led to the VIMS teams claim that the fractures are young, less than 1000 years old, maybe even 10 years or younger. However, they are basing this on compositional evidence of the crystallinity of the ice. The crystalline ice could be ice brought up to the surface after the most recent eruption, not necessarily signalling that the fractures themselves are 10-1000 years old (though we couldn't rule it out, no craters larger than 400 meters or so have been found south of 70 degrees south latitude). VIMS also found simple organics along the fractures with a similar distribution of crystalline ice, based on an absorption at 3.44 microns.

So how did that material, crystalline ice which requires relatively warm temperatures (> 110 K), which appear to have coarse grains based on other VIMS measurements and ISS color spectra, and simple organics get there? INMS, as mentioned below, measured mostly water vapor above the south pole, along with N2, CO2, Hydrogen, and 1-2% CH4 and C2H2. So one could envision the plume scenario powered by a water-ammonia diapir almost directly below the south pole, where water vapor escapes from fresh fractures in the crust. The material with the lowest energy will be deposited just adjacent to the fractures and the material with higher energies will form a plume and then a transient, patchy atmosphere. So far, no nitrogen-bearing compounds in spectra of Enceladus and only hints of CO2 have been observed. But still, depsosition from a plume, rather than sublimation of fine-grained, amorphous ice seems reasonable. It is possible, though, that surface ices bordering the warmer fractures were transformed into crystalline, coarse-grained ice from the heat coming from the fractures. However, the simple organics, found no where else on the satellite (in fact the spectra of the rest of the satellite mirrors laboratory-quality water ice), would still need to be explained.

Even More Enceladus from the BBC and New Scientist


New Scientist and BBC News both have fantastic articles on the press conference today in London on Enceladus. Both cover similar results from the two press releases, but both do mention that VIMS found simple organic compounds along the tiger stripes (shown above) in addition to crystalline ices. This may confirm the marginal detection of methane in the INMS mass spectra. No word yet what the simple organics are. I'm trying to find out as I type this. The New Scientist articles does go into speculation that the boulders seen by ISS at very high resolution may be lava bombs, but such a mechanism may not be necessary given the intense tectonic reworking of the region. Torrence Johnson is quoted as saying, "They are awfully large, but Enceladus' gravity is weak, so it doesn't take much to lift stuff off the surface".

Major Eruption at Enceladus?


In the first half of 2004, as Cassini approach Saturn prior to SOI, UVIS detected a dramatic increase in the amount of atomic oxygen in the Saturnian system, centered near the orbit of Enceladus. At the time of the announcement, the increase in mass in the region, roughly equivalent to the total mass of the E ring, was attributed to the collision of two km-sized particles in the E ring. However, the UVIS principle investigator, Larry Esposito, stated at the CHARM telecon today that "the water vapor escaping from Enceladus is adequate to supply the atomic oxygen in the Saturn system detected by UVIS, and to re-supply Saturn's E ring." So, what do we make of these two pieces of data, the likelihood that Enceladus supplies the atomic oxygen in the Saturn system and this dramatic increase in atomic oxygen last year. The obvious mechanism would be a major eruption on Enceladus. During this eruption, tremendous amounts of dust and water vapor was pumped into the E ring and the Saturn system. Certainly a very interesting idea that hopefully the UVIS team is examining.

"Enceladus Eruptions" CHARM presentation

Today's CHARM talk covered the UVIS results at Enceladus from the flyby last month. I've linked to the PDF file with the slides from the talk above. This talk fit nicely with the press briefing today since it perfectly covered many of the discoveries announced at the talk plus providing more in-depth analysis of the data as well as...more graphs. UVIS detected an atmosphere on ingress of the gamma Orionis occultation in July but failed to detect an atmosphere during the occultation in February. The path of the occultation allowed for measurements at a far southern latitude on ingress, allowing UVIS to measure the patchy atmosphere measured by MAG and INMS. UVIS was able to detect the atmosphere starting at an altitude of 155 km above the surface of Enceladus using the High Speed Photometer (HSP) on UVIS. Compositionally, UVIS found that the atmosphere/plume was made primarily of water vapor with no detection of CO (thus placing an upper limit on CO at 2x1014 cm-2. This is important because INMS detected a species at mass 28 which can either be CO or N2. N2 could be a disassociative product of ammonia in Enceladus' patchy, slushy interior.

In addition to the UVIS data, the talk, by Larry Esposito the UVIS Principle Investigator, also has data from INMS, with a plot of their data from below 500 km. The plot shows a high number of counts from H2O and less amounts from a species at mass 28 as well as hydrogen and maybe methane. The detection at mass 44 is a mix of background noise and CO2. The presentation also has plot from the simulation the CDA team ran to show that their data was consistent with a spread out source near the south pole.

Esposito concludes by stating that the composition of the atmosphere is mostly water vapor with a near surface abundance of 1.5 x 1016 cm-2 with an upper limit on CO at 2% the water vapor density. The atmosphere is not global and has only been found near the south pole. Finally, and here is the kicker as I will go into with more detail later today, "The water vapor escaping from Enceladus is adequate to supply the atomic oxygen in the Saturn system detected by UVIS, and to re-supply Saturn's E ring."

Update 12:45 pm: The detection at mass 44 is a mix of background noise and CO2. Not sure what the mix is, but is less than the detection at mass 28...

More on Today's Enceladus News


As mentioned in the last post, the ISS, CIRS, INMS, and CDA teams worked together to produce a plot showing the locations of peaks in temperature, water vapor, and dust on a polar projection map of the surface of Encleladus. At first glance, the peaks for INMS and CDA would seem to suggest that the circumpolar ring of folded, tectonic terrain may be the source of the vapor and dust. However, neither peak is located within the region of warm ice seen by CIRS, an area that would be more likely to see significant activity. Numerical simulations by the CDA team, combining the timings of the CDA and INMS peaks, suggest that both the vapor and the dust are connected, have the same source, and are distributed across a small region on the surface near the south pole. The source is not impact-generated dust which would be uniform across the surface, as originally thought.

So what does this say about how the vapor and dust form? Three possible scenarios were presented at the press conference. The first scenario sugggests that sublimation of ice within warm, 140 Kelvin fractures, could produce the vapor. This would fit with the lack of a visible plume by ISS but may not fit with the dust detections. The dust could possibly be produced by condensing vapor, but this may not be supported by the CDA data. The second scenario suggests that vapor and dust are generated by a plume that eruptions along the tiger stripe fractures. This would easily allow both vapor and dust to be ejected to the altitudes seen by INMS and CDA but thus far, no plume has been observed by ISS. The third scenario suggests that vapor and dust could be produced by sublimation along cryolava flow fronts. While some of the terrain between the tiger stripes looks like a lava flow, the distribution of crystalline ice seen by VIMS and the blue-green course-grained ice seen by ISS have been observed along the fractures, not within the flows, so it seems that this scenario may not fit the current conditions. My only complaint about the graphic is that it assumes that the interior is made of only water, not water mixed with ammonia, which would lower the melting point of water. I don't see why you can't have the plume scenario with a sub-surface layer of water mixed with ammonia (just to answer Jerry's comment about the required temperatures).

So which scenario are scientists leaning toward? Considering current conditions and what we have observed geologically, I would definitely lean toward the second scenario for a few reasons. While we have not observed a plume, there are some indications that activity at Enceladus may be quite variable. UVIS detected a large increase in the amount of oxygen in the E ring early last year. Considering that the primary source of the E ring is now found to be the south polar vents, it seems reasonable that such a mass increase could have been due to a major eruption on Enceladus. Such variability with time may be difficult to achieve with the first scenario. Plus, one has to consider how you get dust particles along with the vapor in a purely sublimation scenario. You can do it, but I find it hard to believe you can do it with this much dust. The third scenario could partially fit, the terrain between the tiger stripes does look an awful lot like a lava flow. However, the distribution of course-grained ice, the sublimation problem mentioned in the first scenario, and the lack of ammonia detected on the surface seems to suggest that the cyroflow sublimation model is not the best fit. So I would consider the second model, the plume model, as the best fit to the data.

The ISS team also released preliminary tectonic maps showing the distribution of longitudinal and latitudinal fractures on the surface. These maps show that many of the fractures on Enceladus follow longitude and latitude lines, perhaps caused by the changing shape of Enceladus as the tidal stresses on Enceladus wax and wane. In addition these maps outline a wavy, circumpolar ring of fractures at around 55 degrees South latitude, marked by Y-shaped discontinuities that lead into fracture systems that lie along lines of longitude. Such fractures could be caused by "hoop stresses", formed during periods when the equator expanded, perhaps as Enceladus was sped up. Unmarked versions of these maps of the north and south polar region show the marked difference between the two polar terrains. The north polar region is heavily cratered and is the oldest region on the surface of Enceladus. The south polar region is very young with very few craters south of 55 degrees south, and none (larger than 200 meters) south of 70 degrees south. Note the hooks at the end of the tiger stripe fractures.

More Enceladus to come.

Tiger Stripes on Enceladus found to very young and active


At a press conference in the UK at the Cassini PSG (Project Science Group) meeting, additional details from the July flyby of Enceladus were revealed. The briefing focused on the cryovolcanic activity observed in the south polar region observed by a number of Cassini's instruments, including ISS, VIMS, CIRS, INMS, UVIS, and CDA. There is a lot of ground to cover on this and I will be posting several times today on this story.

First, INMS and CDA observed asymmetries in their data that have been plotted on a graph as well as shown on a polar projection map of Enceladus with the ground-track and the locations of the CDA and INMS peaks, and the CIRS hotspot, indicated. Previously, CDA reported that their data was consistent with impact-generated dust, not from endogenic activity. If you look at the graph, it is pretty close to a bell-shape curve, which is what you would see in an impact-generated dust scenario. However, the curve is shifted in time from closest approach, with the peak occuring 70 seconds before C/A. In the impact-generated dust scenario, the peak would be right at closest approach, so this shift would not be consistent with that scenario, but with one where dust is ejected up to a certain height from a volcanic vent. So it now appears that the south polar region of Enceladus is the source of the very small particles in the south polar region. UVIS data from two star occultations in February and July also seem to suggest that the "atmosphere" produced by the venting of water vapor and micron-sized dust is not global and localized to the south polar region.

VIMS was also at the press conference, showing a view of the surface of Enceladus taken by their instrument. This image shows the distribution of crystalline ice on the surface, which under Enceladus conditions quickly degrades to amorphous ice. VIMS found that there was quite a bit of crystalline ice in the area surrounding each fracture collectively known as the tiger stripes (because of their appearance and the way they standout in the normally very bright south polar region). Considering the conditions at Enceladus, crystalline ice is expected to convert to amorphous ice over a period of several decades so geologic activity along the stripes must have occured between 10 and 1000 years ago (though more recent episodes are certainly possible, and likely, as I will discuss in a post later today).

In my next post, I will discuss the ISS releases as well as the possible models for activity.