Thursday, May 12, 2005

Press Release: Titan's Atmosphere Revealed by New NASA Observation

The CIRS team has released a press release on the results announced today. I am about to leave for home so I don't have to read it, but you can check it out yourself at the link above.

Titan Science Magazine Special Issue

The Titan Science Special Issue is now out. I have read through the RADAR paper, and have posted an admittedly lengthy summary below. This is, after all, the stuff I am most interested in, so naturally I feel every thing written is important. Once I get to the RPWS results, I might just post one or two comments ;) BTW, I have not read the other papers. I intend to do that during Survivor tonight and will post a summary tomorrow.
  • C. Elachi et al. Cassini Radar Views the Surface of Titan. Science 308, pg. 970-974.
    • Not dissimilar from the LPSC abstracts presented earlier this year
    • Only covers results from the Ta RADAR SAR swath (no results from T3)
    • Don't forget to check out the Supplementary Online Material for this paper. Within the document is a 128 pixel/degree version of the Ta Sar strip. This document also contains maps of backscatter cross-section and brightness temperature variations.
    • Titan's surface appears to be youthful thanks to its relative lack of impact craters and fairly heterogeneous
    • Five surface units observed based on brightness, morphology, and texture
      • Dark Homogeneous unit
        • Regional in scale
        • Covers one-fourth of the Ta Sar Swath
        • Relatively low backscatter
        • Patchy in SAR swath
      • Mottled Unit
        • Regional in scale
        • Covers much of the rest of the Ta Swath
        • Higher backscatter
        • Gradiation at boundaries with Homogeneous unit
      • Bright Lobate unit
        • Local scale unit
        • Variable brightness
        • Gradational and sharp boundaries with both digitate and sheet examples
        • Sometimes somewhat circular
      • Bright, lineated unit
        • Local scale unit
        • Seen east of Ganesa Macula
        • Sharp borders
        • Lineations within, spaced 1 to 2 kilometers apart
        • Maybe akin to the grooved terrain of Ganymede
      • Dark, patchy unit
        • Local scale unit
        • Halloween Cat an example
        • dark patches tens of km across
        • Connected by narrow dark features
        • Topographically controlled?
    • Large, circular feature 180 km across, named Ganesa Macula, could either be a "pancake dome" or relaxed crater
      • 20-km wide central pit, maybe a caldera
      • Channels radiate to the south from the central pit
      • Lobate features along eastern edge might be flows
    • Backscatter cross-section data, from the scatterometry mode, shows several distinct surface units that seem to correlate with albedo in ISS images
      • "Raw" backscatter cross-section data shows the highest backscatter in the central portion of Xanadu, eastern "Sumatra", and near the 80-km wide crater (from SOM)
      • The southwestern portion of Xanadu shows the largest difference between radar backscatter and near-IR albedo, with moderate back scatter even for areas that are brightest in ISS and VIMS
    • Radiometry data shows disk-averaged brightness temperatures of 85-86K. This yields a surface emissivity of 0.9 based on an actual surface temperature of 94K
      • Dielectric constant between 2.1 in the northern mid-latitudes and 1.6 for the southern mid-latitudes
      • Consistent with hydrocarbons or porous ice
      • Disk-resolved observations show significant brightness temperature variations (+/- 10K) with a rough anti-correlation with near-IR albedo and backscatter; due to emissivity variations
        • In other words, darker, smoother material is warmer radiometrically than brighter, rougher material
    • RADAR altimetry and radarclinometry (shape-from-shading) results show that for the small region of Titan looks at in Ta, very little topographic variations is seen, with only 150 meters of variation in the altimetry data over 400 km. Radarclinometry results indicate a few topographic features, such as the small 15 km wide hills seen at the end of the swath. This hills appear to be 100 m tall. A flow-like features was found to be 250 meters tall. A larger flow-like features was found to have a height of 1 km, considered to be too large by the RADAR team. This results may have been hampered by gradations in texture on the surface of the flow.
    • No obvious impact structures found on Ta. Cryovolcanism is the favored method of resurfacing by the RADAR team
    • Based on comparisons between Cassini RADAR and Arecibo data, the largest contributor is bright SAR and scatterometry returns is volume scattering. Volume scattering occurs when a radar beams is scattered multiple times with a material, in this case presumably ice, before returning to the antenna. Pure water ice and other tranparent materials tend to be better volume scatters than ice with impurities like ammonia. So brightness variations in scatterometry and SAR data maybe due to compositional variations, where pure water ice would appear bright not only because of a higher dielectric constant but would appear enhanced due to volume scattering.
    • Alternatively, porous polyacetylene would appear optically bright and radar bright (due to its semiconductive properties) when floating on a lake of methane

New Cassini Image: Pair to Compare


CICLOPS has released this view of Dione (top) and Tethys (bottom), as viewed in the same narrow-angle camera field-of-view on March 19 of this year. In this case, we are looking at the trailing hemispheres of both moons. The trailing hemisphere of Dione is quite different from its leading hemisphere, which bears the famous wispy markings. This hemisphere instead shows only craters. However, it doesn't appear as heavily cratered as the trailing hemisphere of Tethys. This view of Tethys highlights the Odysseus (1:30 position) and Melanthius (6 o'clock) impact basins. For both moons, the pixel scale is 15 km/pixel.

Wednesday, May 11, 2005

New Huygens Large Coverage Mosaic by Rene Pascal

Rene Pascal has released version three of his fantastic large coverage map. This mosaic makes use of the highest altitude images that show surface features as well as a few lower altitude images near the landing site. This version updates the position of some of the frames, adds higher resolution data near the landing site, as well as adjusts the location of the landing site based on the determination of the DISR team.

Definitely an image worth checking out.

New Iapetus Image: Details in the Dark


CICLOPS has released this new, low-resolution view of Saturn's outer moon Iapetus. This view of Iapetus was taken on March 19, one Iapetus-day after the first, relatively decent encounter with this satellite. Compare this view with one taken during that encounter. This image shows the prominent equatorial ridge, which rises to a height of 20 km in some places. Elsewhere on the satellite, two large impact basins can be seen, one along the day-night terminator at the 3 o'clock position and another near the transition between dark Cassini Region and bright Roncevaux Terra at the 10 o'clock position.

This image has a resolution of 8 km/pixel and was taken from a distance of 1.4 million kilometers.

Tuesday, May 10, 2005

More on S/ 2005 S 1: The Keeler Gap Moon (AKA the Wavemaker)


This was reported earlier from the IAU Circular, now here are some additional images

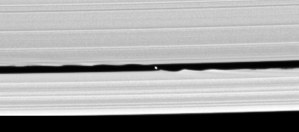
The ISS team has announced the discovery of S/ 2005 S 1, first found in image taken of Saturn's rings on May 1, 2005. This 7.5 km wide moonlet was found in observations of the Keeler Gap, a 35-km wide clearing 250 kilometers from the outer edge of the A Ring and the outer edge of the classic ring system. Released today are two images and one movie. The movie uses images taken during the discovery observation on May 1, 2005 and show the moon orbiting Saturn within the Keeler Gap. Density waves can be seen on inner edge of the Keeler Gap preceding S/ 2005 S 1 and on the outer edge of the Keeler Gap trailing the newly discovered satellite. CICLOPS has also released a composite frame from this observation. This composite frame is a super-resolution summation of all the frames showing this satellite to improve the overall resolution of the image. In addition, a frame from an observation the next day shows this satellite at better resolution. This allowed imaging scientists to measure the diameter of the satellite. From the diameter and the brightness of the satellite, scientists are able to deduce that the albedo is 0.5, similar to the albedo of the surrounding ring material.

The discovery of this satellite is not completely unexpected. Observations taken shortly after SOI showed many of the same tendrils and waves seen in the Encke Gap and the F Ring, that are caused by the gravitational interaction between these ring features and Pan and Prometheus, respectively, on the outer edge of the Keeler Gap. Until now, the cause of these waves had not been observed.

Now that this moon has been discovered, scientists plan to go back to the SOI ring images as well as the images taken during this revolution and the orbits in this portion of the mission to examine the waves in the ring system caused by S/ 2005 S 1. Examining the intensity of these waves should help yield a mass estimate for this new moon, as was done for Atlas and Pan. Examing the amplitude of the waves seen here along the inner and outer edges of the Keeler Gap can also provide an estimate of the mass of S/ 2005 S 1.

New Saturnian Satellite: S/ 2005 S 1


In IAU Circular #8524, C. C. Porco, CICLOPS, Space Science Institute, Boulder; and the Cassini Imaging Science Team announced the discovery of a new satellite of Saturn orbiting within the Keeler Gap of the outer A ring. The discovery was made using 16 images from a day-side ring observations taken on May 1. The moon was later found in earlier images from April 13 that focused on the F-ring (one of these images shown above). The satellite was then later found in disk-resolvable images taken on May 2. The 7-km wide S/ 2005 S 1 orbits Saturn from a distance of 136,500 km, requiring 0.594 days to orbit the gas giant. Based on observations taken thus far, this moon has an albedo of 0.5. With the images taken thus far, a statistically meaningful eccentricity and inclination has not been determined.

Thanks to The Singing Badger and alan over at the Unmannedspaceflight.com forum for the information that went into this report.

New Hyperion Image: What's the Spin?


CICLOPS has released this processed view of Saturn's moon Hyperion, taken in mid-March. This view shows a 130-km wide impact crater at the top of this view. Hyperion rotates chaotically, rather than regularly like nearly all other satellites in the solar system, though a few spin states are common. This is the second-highest resolution view of Hyperion so far taken with an original resolution of 8 km/pixel (this image has been magnified 2x for easier feature visibility). Next month, Cassini will have a distant encounter of Hyperion from a distance of 166,000 km, producing resolutions on the order of 1 km/pixel. Then, in September, Cassini will have a targeted close encounter with Hyperion, coming within 500 km of this chaotic moon.

Monday, May 09, 2005

Raw Images of the Week

Due to the annoying problem of the JPL Raw images page not posting all the images taken by Cassini ISS, I haven't been able to do one of these in a while. So without further ado, here are latest and greatest Cassini Raw images:
Update: Turns out the JPL raw images page IS posting pages for all the images, but only a select few actually show up on the page. However, the pages for the non-appearing images, like this one, again don't have images, but do describe it. The plot thickens.

Huge Surface Coverage Mosaic of Titan

Rene Pascal has released a new huge mosaic using Huygens images. This mosaic combines his latest large coverage map composed primarily of MRI images with the side-looking imager mosaic he created previously. He states on his website that this mosaic likely represents the largest coverage map of Huygens images that can be produced. Personally, I liked his large coverage map better, compared to this "huge" coverage map, since the SLI images have seem to show scattered light from the atmosphere. One place where the SLI images seem to have their best effect is in the region north of the main island. This area has two dark streaks which might be akin to the "cat scratches" seen by RADAR.

On another note, the mosaics released by the DISR team last week have north up, though north may change by as much as 10-20 degrees. This may put us back to square one in trying to determine the location of the landing site by comparing DISR and ISS images. I agreed with Rene on where the landing site was, though I didn't buy the idea that the altitudes determined by the DISR team were off by more than 40%, but now we may need to find some place else.

Results from last month's EGU Conference

Jon Clarke over at Space.com's message board has posted information he gathered from last month's EGU conference in Vienna. Being only a little over a month since the LPSC conference in Houston, I wasn't expecting many new results but there are a few really interesting tidbits:
  • From Huygens, the highlands are brighter and redder than the lowlands. From the surface images, we know that the low lands are covered in pebbles, 8-10 cm in size. Based on calculations, it was determined that methane fluvial flows moving at 1 m/second would be required to transport clasts of that size. We know from LPSC that the highlands are between 100 and 200 meters higher in altitude than the lowlands. From EGU, we now know from the Sonar instrument that there are two distinct levels within the highlands, one 8 meters taller than the other. This higher level might consist of small mesas surrounded by lower level material.
  • A talk by Raulin et al. discussed the implications of the discovery of higher order C-N compounds with up to 7 carbons (found by INMS last month). They suggest that these are the tholins predicted by Sagan et al. In addition, they believe that based on the overall atmospheric abundance, the most abundant liquid phase on the surface is ethane.
  • In the VIMS talks on Iapetus, they note that the ices in Cassini Regio include CO2 and C-N (as noted last month, this result is similar to that of Phoebe, except very little water ice was found in Cassini Regio). In terms of the origin of Cassini Regio, the speakers at the conference seemed to shy away from an external origin, due to the distribution of the dark material not being hemispherical, and from a cyrovolcanic origin due to the diffuse nature of the transition zone. The authors note that that Cassini Regio is symmetric north-south from the ridge. One author even went so far as to suggest that Cassini Regio originated from geysers along the ridge. While I admit that I once posited that myself, the apparent rigidity of the crust, the ancient age of the ridge from the number of crater on it, the apparent youthful age of the dark material, argues against this hypothesis. Personally, I like the idea suggested at LPSC that the dark material isn't so much the emplacement of dark material, but the striping off of bright material, that the almost total absence of water ice in Cassini Regio suggests that it was removed somehow, leaving behind a dark, fluffy, lag deposit.
I want to thank imran at the Unmannedspaceflight.com forum for the heads-up on this.

New Cassini Image: Mimas And Dione


CICLOPS has released this view of Dione and Mimas as seen in the same narrow angle field of view on March 18. During the period from mid-January to late-March, a number of these mutual events were observed. Resolution is too low on Mimas (upper left) to see any features but characteristic wispy markings can be observed on Dione (lower right).