Friday, September 09, 2005

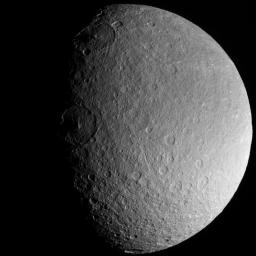
New Rhea Image: Frame-Filling Rhea


CICLOPS today released this processed image of Rhea taken on August 1, 2005. This image was taken from a distance of 255,000 km and has a resolution of 1.5 km/pixel. As the title suggestion, this image was taken when Rhea nearly filed the entire narrow-angle camera field-of-view. Nothing shocking from Rhea, just lots and lots of craters (with a few fractures up at the top toward Rhea's wispy terrain). This image primarily shows the southern trailing hemisphere of Rhea. Two prominent impact basins, ~300 km across can be seen along the terminator. The top basin is unnamed but the second basin is Izanagi. This basin was the site of one of the pre-launch artwork done for the Cassini mission. No sign of the fractures shown in that rendition.

Wednesday, September 07, 2005

T7 Coverage Map


CICLOPS has released the coverage map for today's flyby of Titan. Cassini ISS will examine the sub-Saturnian hemisphere of Titan, particularly around the Fensal-Aztlan region (formerly known as the "H"). The coverage for this encounter will primarily come from two mosaics. The first, MONITORNA001 outlined in green, is a 2 km/pixel mosaic over the entire visible disk. This is similar to other full-disk mosaics from Ta and T3. The second mosaic, COMBINED001 outlined in red and yellow, is a higher resolution mosaic consisting of many images near the center of the visible disk. Key targets for this mosaic include features within Fensal, Aztlan, Quivira, and northern Tsegihi regions, such as Bazaruto Facula (with its 80-km central crater), Omacatl Macula, and the debris deposit in northeast Aztlan that bisects Quivira.

A map showing RADAR SAR coverage is also available.

New Dione Image: Older Southern Fractures?


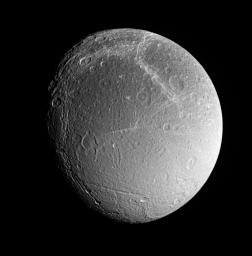
CICLOPS released today this processed view of Dione on August 1. This image was taken from a distance of 269,000 km and has a resolution of 2 km/pixel. The wispy terrain of Dione can be seen toward the top with Padua Linea running from top center to right and Palantine Linea running along the terminator at left. In contrast to these relatively sharp fractures, the fracture systems near the south pole, just to the left of the large impact basin, have relatively subdued topography and are probably older than the fractures that make up the wispy terrrain. The radial feature near the center of the disk, Cassandra, was thought to be caused by a ray crater, but analysis of the topography associated with the feature now shows that Cassandra likely has a tectonic origin.

Note the two craters just to the left of Cassandra. These craters have a similar shape to Ali Baba and Aladdin craters on Enceladus, perhaps indicating local heating in that region of Dione, in order to produce the viscous relaxation we observe.

New Look

The formatting and column issues have bothered me (and others) for the last time. I have switched to a different template within Blogger to see if that helps, but a few features from the old template, like recent posts, are now gone :( I will try to fix that soon enough.

Tuesday, September 06, 2005

Titan-7 Flyby Info


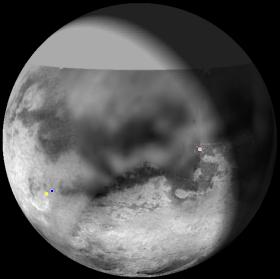
View of Titan from Cassini 2 hours into ISS' high resolution observation, about 3 hours prior to closest approach (sub-spacecraft point=4.4N, 26.2W). The plot was generated in GISS' Titan 24 software. The map is derived from ISS map released in March (ask for full version used here, just adds blank space north of 34N). The full version of above plot is available as well as one with feature labels. The data for plot was obtained from Mission description document.

T7 Quick-facts:
  • Closest approach occurs on September 7 at 1:33 am PDT
  • Closest Approach Distance = 1075 km (bumped up from 950 km)
  • Relative speed WRT Titan = 5.9 km/sec
  • Closest Approach Lat and lon = 67 South, 308.1 West
  • South Polar Pass with sub-Saturnian hemisphere visible inbound
  • Outbound flyby (sunlit inbound)
  • Phase angle at -3hours = 51.5 deg.
RADAR SAR and ISS imaging highlight the science plans for tonight's T7 flyby of Titan. This is the 8th flyby of Titan out of 45 planned for the nominal mission. The 7th flyby, T6, took place on August 22, and yielded plenty of data for CIRS and MAPS, but not much for the other remote sensing instruments. However, during T7, RADAR, ISS, and VIMS make up for lost time.

This flyby is lower than the August flyby, with Cassini coming within 1075 km of the surface of Titan. This is higher than the originally planned 950 kilometers. Many of the 950 km flybys may have to be similarly raised due to higher atmospheric densities at higher altitudes than expected. As you can see in the above plot, Cassini will once again look at the sub-Saturnian hemisphere of Titan on its inbound leg. This hemisphere has been in view of the last 3 flybys, but have no fear, Cassini will return to the anti-Saturnian hemisphere and the Shangri-la region during T8 in late October.

ISS controls the spacecraft for much of the period prior to closest approach. Two large mosaics are planned. The first is a mosaic at about 10 hours out. This should have similar coverage and resolution to the global mosaics taken during Ta and T3, global with a resolution of about 2 km/pixel. The second is a higher resolution mosaic taken from 5 hours out to about 1 hour out. The coverage map for this mosaic should be out soon, but this mosaic would have enough time to build up a large mosaic with similar coverage and resolution to those taken on Ta and Tb. Overall this is shaping up to be one of the better flybys for ISS in some time. Phase angles are similar to those from the past few orbits, higher than those from Ta-Tb-T3. Lots of interesting features at the center of the disk including Bazaruto Facula (with an 80-km wide crater at its center), Quivira with its possible channels and a debris deposit bisecting the feature and flowing into Northeast Aztlan, and Omacatl Macula.

RADAR is back for T7. So far, RADAR has acquired two SAR (synthetic aperature radar) swaths, first on Ta and again on T3. Both swaths covered portions of the northern leading hemisphere. On this encounter, RADAR SAR will acquire a swath over the southern sub-Saturnian hemisphere. I have produced a coverage plot for this swath, though I would ask that it not be reproduced on other sites. The swath starts out in north central Tsegihi, an area of bright terrain, which appears to be similar to Xanadu but slightly darker in albedo. Like Xanadu, Tsegihi is a region of mottled terrain, though with less contrast than Xanadu. Continuing along, RADAR will run into Mezzoramia, a "dinosaur-shaped" dark region that maybe a temporary reservoir of seasonal rainfall run-off from the south polar region. Images of Mezzoramia from July of last year indicated a possible difference in how sharp the southern and eastern boundary is compared to the western and northern boundary. It will be interesting to see if such a difference is detected in the RADAR coverage of the region. The SAR swath continues to as far south as 77 degrees south Latitude, even farther south than Ontario Lacus, a 235-km wide dark feature that maybe a lake. Many of the lake-like features near the south pole appear to concentrated on the leading hemisphere side of the pole, though this could be an emission angle effect (surface contrast improves as you approach the sub-spacecraft point). So RADAR SAR may miss most of the larger "lakes", but smaller features, like those seen on Ta, are possible. T0 images reveal a possible dark feature that maybe similar to Ontario Lacus to the southeast of Mezzoramia, near 70 South, 330 West, so that might be something to look out for. The eastern half of the SAR swath is in a region not seen very well by Cassini ISS (best pixel scale ~ 35 km). This region could be very similar to the area seen by RADAR on Ta, with a lot bland terrain puntuated by the occasional volcanic center.

RADAR also has altimetry and radiometry on this pass. Altimetry will cover the bright-dark southern boundary of Chang-tu at the far eastern end of the RADAR SAR swath. There should be altimetry at the far western end as well, checking for topography associated with Shiwanni Virgae and north-central Tsegihi. Hopefully, the altimetry won't show a slope to the east this time ;-) RADAR Radiometry will look at the thermophysical properties of the northern anti-Saturnian hemisphere, to compare with results from Ta, which looked at the northern sub-Saturnian hemisphere. This data, taken after closest approach, will cover the region that will be seen by RADAR SAR in late October during T8, an east-west swath that will cover central Belet and central Adiri. This region will also be see quite a bit by the remote sensing instruments, like ISS, later in the mission.

Of course, other instruments will gather data during this encounter. UVIS has their second star occultation of Titan's atmosphere, this time using alpha Pegasus (Markab). UVIS will be using the occultation to look for N, N2, and hydrocarbons at various latitudes. This is a "glancing" occultation since the star will not pass behind the limb of Titan, only the upper atmosphere. The December 2004 occultation of lambda Sco allowed UVIS scientists to detect various hydrocarbons like methane, acetylene, diacetylene, ethane, ethylene, as well as Hydrogen cyanide in Titan's atmosphere as well as measure the abundances of those species. VIMS is prime for almost 4 hours on approach to Titan, starting around 8 hours and 45 minutes before closest approach. This will allow VIMS to create a full-disk mosaic similar, but at lower resolution, to our MONITOR mosaic taken shortly before VIMS' MEDRES observation. VIMS will also take a few snapshots near closest approach northeast of Shiwanni Virgae. CIRS and the Fields-and-Particles instruments will also be active on this encounter. CIRS will be continuing to look for variations in the distribution of hydrocarbon species both temporally and spatially. The MAPS instruments, like MAG and MIMI, will continue to examine the interaction between Titan and Saturn's magnetosphere.

Playback of T7 data takes place during two playback periods. The ISS images of the surface will be returned tomorrow night and Thursday morning and should show up on the JPL raw images page Thursday afternoon, PDT. The rest of the data will be played back starting at around 5:30 am Friday morning, PDT and will continue until around 2 pm PDT. Images from this period, mostly from after Closest approach, should be on the raw images page Friday evening. RADAR SAR data will be played back during this playback period, so don't expect any data from them to show up until at least Monday, and even that is pushing it. Given the weekend and the fact that a number of RADAR team members are in transit from the DPS conference that takes place this week, I wouldn't expect any images from the RADAR team until at least Wednesday. I know that's a long time, but we should have patience with the RADAR team in getting their data assembled.
DPS News and Notes

The AAS' Division of Planetary Sciences Conferences is taking place as I type in Cambridge, England. No, I am not there. But the Planetary Society's Emily Lakdawalla is and she has a great blog post with some of the results from yesterday's Cassini talks. Among the highlights include Larry Soderblom's confession that the DISR mosaics may have north off by as much as 15 degrees counter-clockwise, which is a major relief for me given my work to try to find the landing site in ISS images. Given their current understanding of "north", I could not find any site that matched orientation of the islands seen in the DISR images. Now with this revelation, there is a solution (easternmost tip of Adiri). Larry also mentioned the planned coverage by RADAR SAR of the landing site in T8. This swath is an east-west pass across central Belet and Adiri. The RADAR team extended the Beam Three path (at the expense of altimetry) to try to cover the landing site, but the signal/noise ratio maybe a bit low, I'm afraid. Hopefully, something good will come out of it and we can start making sense of all our data. FYI, RADAR SAR swaths are composed of five beams (you may have noticed the seams in early RADAR products). Beam three is the center beam and has the best signal to noise ratio. The Principal Investigator of the HASI instrument on Huygens reported that his instrument found a number of inversion layers in the Titan thermosphere. This confirms the INMS result that showed a number of waves in the methane and temperature profiles in the upper atmosphere. Apparently this wave structure continues down to at least 510 km. Now why is this so important... The SSP and the Permittivity Sensor on HASI both detected slight changes in conditions at the surface after landing. The increase in permittivity and changes in the speed of sound and spacecraft tilt maybe related to the vaporization of methane by Huygens as it sat on the surface, but that is just one possibility.

There were a number of results from the instrument teams from onboard Cassini. Many of the major results announced today were related to the rings and Saturn, and rightly so since admittedly they have gotten very little press coverage compared to the satellites so it is good they have their day in the sun. But this is a blog about the satellites, so who cares about those results ;-) Most of the Enceladus results were announced earlier at a press conference but some instrument teams did clarify them. VIMS last week announced they had found crystalline ice (absorption band at 1.65 microns) and simple organics (absorption band at 3.44 microns). During his talk, Bob Brown mentioned that the aborption band is attributed to a C-H stretch. In other words, it is some kind of organic compound, but VIMS can't tell what it is with just this one absorption band. Brown also announced that VIMS had not found any ammonia on Enceladus, shutting the door on ammonia-water volcanism. I'm not sure I agree with him there, but we may want to look at models that don't include ammonia. This also fails to explain how INMS saw N2. The CIRS principal investigator, Mike Flasar reported on results from Enceladus. In addition to the hotspot in the south polar region, CIRS found a relatively low thermal inertia, indicating that Enceladus is covered in unconsolidated material. Perhaps due to infalling E-ring material.

Finally, the RADAR team presented their results from T3. The most interesting features in that swath were the numerous linear to sublinear dark streaks, nicknamed cat scratches. These features have been interpreted as linear or longitudinal dunes, similar to those found in Saudi Arabia and Australia (near "Lake" Eyre). However, the RADAR team has been comparing the scratches to icy dunes in Antartica, which are visible in RADAR images of the continent, but not so much from the ground. The dunes take the form of changes in grain size rather than topographic features that one could see from the ground. Such an interpretation would jive with ISS' inability to resolve the scratches if both the dunes and the material that fills in between them are dark at 938 nanometers.

RADAR also released an image yesterday showing these dunes and a couple of drainage channels west of the "Circus Maximus" impact basin.

New Janus Image: The Two Faces of Janus


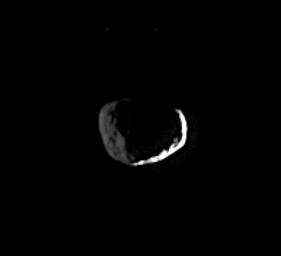
CICLOPS has released this view of Saturn's moon Janus taken on August 2. This view shows only a slim crescent of Janus lit by sunlight, highlighting a couple of craters near the terminator. On the left side, however, Janus is dimly lit by Saturn, to the left of this image. Several large impact craters are visible in the Saturn-shine.

Janus is a small, irregular satellite of Saturn, only 181 km across. Cassini's closest encounter with Janus won't come until the very last day of the nominal mission, June 30, 2008, when Cassini is scheduled to come within 45,000 km of the surface of this satellite. Cassini flew within 50,000 km of another small satellite of Saturn, Pandora, yesterday for Cassini's closest encounter with that satellite during the nominal mission.

Monday, September 05, 2005

Pandora Rev14 Non-Targeted Encounter


Today, Cassini will come within 52,000 km of the surface on one of Saturn's small, inner moons, Pandora. Pandora acts as one of the shephards of the thin F ring, orbit just outside of the ring. Pandora is a small, irregular, with a diameter of 114x82x62 km. Voyager views of Pandora's surface showed a ancient, heavily cratered world, but Cassini views, like the one above, suggest that, though heavily crater, small-scale topography may be subdued, perhaps due to F ring material mantling the surface.

This encounter with Pandora, while not a targeted flyby, will provide our best views of the satellite thus far and at 52,000 km, this will be the closest Cassini will come to this satellite. The best possible images from Cassini at closest approach would have a resolution of 300 m/pixel over the satellite's trailing hemisphere (assuming that it rotates synchronously which I believe it does).

Images and other data from this non-targeted encounter should be returned tonight or tomorrow.